Mei-Bian Hu,
Wei Peng,
Yu-Jie Liu,
Dan Yan,
Xi Chen,
Chun-Jie Wu ![]()
For correspondence:- Chun-Jie Wu Email: wucjcdtcm@163.com Tel:+862861801001
Received: 6 May 2016 Accepted: 5 September 2016 Published: 31 October 2016
Citation: Hu M, Peng W, Liu Y, Yan D, Chen X, Wu C. Maillard reaction induces changes in saccharides and amino acids during stir-baking of areca nuts. Trop J Pharm Res 2016; 15(10):2107-2112 doi: 10.4314/tjpr.v15i10.8
© 2016 The authors.
This is an Open Access article that uses a funding model which does not charge readers or their institutions for access and distributed under the terms of the Creative Commons Attribution License (http://creativecommons.org/licenses/by/4.0) and the Budapest Open Access Initiative (http://www.budapestopenaccessinitiative.org/read), which permit unrestricted use, distribution, and reproduction in any medium, provided the original work is properly credited..
Purpose: To investigate changes in saccharides and amino acids induced by Maillard reaction (MR) during stir-baking of areca nuts (AN).
Methods: The pH of aqueous extracts of AN and charred AN (CAN) were measured by a pH meter, and their absorbances at 420 nm were read in an ultraviolet-visible (UV-VIS) spectrophotometer. Changes in saccharides and amino acids were evaluated by high performance liquid chromatography (HPLC) and automated amino acid analyzer, respectively.
Results: The pH of AN (5.85 ± 0.09) was lower than that of CAN (5.25 ± 0.04). Stir-baking significantly increased the A420 value of AN (0.32 ± 0.01 to 0.62 ± 0.02 (CAN). In addition, the contents of reducing saccharides (fructose and glucose) and free amino acids (serine, lysine, arginine and proline) were significantly decreased in the stir-baked CAN compared with AN.
Conclusion: MR, during stir-baking of AN, decreases levels of free amino acids and reducing sugars due probably to the reaction between saccharides and amino acids.
Introduction
MR, also called non-enzymatic browning reaction, is one of the main reactions involved in food processing. The reaction involves the amino groups of amino acids, proteins (or any nitrogenous compound), and carbonyl groups of reducing sugars, aldehydes or ketones [1,2]. Previous studies revealed that MR can result in formation of some new compounds such as 5-hydroxymethylfurfural (5- HMF), methyl maltol, etc and MR products contribute to flavor formation, as well as antioxidant and antimicrobial effects of processed foods [3,4].
AN (Areca catechu LINN) is widely distributed in Southern and Southeast Asia including China, India and Indonesia [5]. It is reported that over 400 million people daily chew betel quid which is prepared from the immature fruits of areca nut, betel leaf and lime in some Asia areas, especially in Taipei, China [6]. AN is also used as an important traditional herbal medicine in China for the treatment of parasitic diseases, dyspepsia, abdominal distension, abdominal pain and diarrhea [5].
Prior to clinical usage, AN is traditionally processed by charring it to a dark brown color through the process of stir-baking, so as to enhance its efficacy and reduce its toxicity [7,8]. Although previous studies showed that MR is involved in the processing of AN, not much is known about changes in saccharides and amino acids during this process. The present study compared saccharide and amino acid contents of AN and its processed product, in order to determine the mechanism involved in the MR.
Methods
Chemicals and reagents
Areca nuts were purchased from the Neautus Chinese Herbal Pieces Ltd. Co. (Chengdu, China), and were identified by Prof Chun-Jie Wu (College of Pharmacy, Chengdu University of Traditional Chinese Medicine, Chengdu, China). A voucher specimen (sAN-20160117) deposited in College of Pharmacy, Chengdu University of Traditional Chinese Medicine (Chengdu, China). All standards in the study were purchased from the National Institute for the Control of Pharmaceutical and Biological Products (Beijing, China). All other chemicals used in this study were analytical reagent grade.
Preparation of samples and standards
Dried AN was powdered and exhaustively extracted with 80 % ethanol for 3 h to remove colored materials. After filtration, the residue was air-dried and extracted with distilled water by refluxing. The extract was left to cool at room temperature and filtered for use in HPLC analysis. Solutions of standard sugars (fructose, glucose, sucrose, raffinose, and stachyose (1 mg/mL)) were prepared in distilled water.
Determination of pH and A420
pH values of AN and CAN extracts were measured using a pH meter (Leici, PHS-3C, Shanghai, China) calibrated with standard buffer solutions of pH 4.0 and 10.0.
A420 values of AN and CAN were measured according to the method described previously [9]. The samples were decocted with distilled water and filtered. The absorbance of the filtrate was measured at 420 nm in a TU-1901 UV - VIS spectrophotometer (Puxitongyong, Beijing, China).
Determination of saccharide contents
The aqueous extracts of the samples and the saccharide standard solutions were filtered through 0.45 μm nylon filters before injecting into HPLC system (Agilent, 1260, USA). In this process, 10 μL of each extract or standard was analyzed using a SepaxCarbomix Ca-NP column (300 mm × 7.8 mm, 10 μm) with an evaporative light-scattering detector (ELSD) (Alltech, 2000ES, USA).Ultra-pure water was used as the mobile phase at a flow rate of 0.3 mL/min, and the temperature of the column was set at 75 °C.
Validation of the HPLC method
Calibration curves of fructose, glucose, sucrose, raffinose, and stachyose were obtained by analysis of different injection volumes (each standard solution was analyzed in triplicate). The calibration curves were prepared by plotting peak area logarithm values against injection volume logarithm values for each saccharide. Linear regression analysis was then used to calculate the slope, intercept and correlation coefficient of each curve.
Precision tests were performed by injecting the same aqueous extract repeatedly 6 times. The peak areas of the five saccharide standards were obtained and their relative standard deviation (RSD) was calculated to assess the precision of the HPLC system.
Repeatability tests were assessed by analyzing aqueous extracts of 6 samples using the above procedure, and the RSD of peak area for each saccharide was calculated.
Stability tests were carried out by analyzing the same water extract every 4 h for 24 h using the same procedure as outlined above, and the RSD of peak area for each saccharide was calculated.
For the recovery tests, selected samples were spiked with known amounts of fructose, glucose, raffinose, raffinose and stachyose, and analyzed by the same method. Mean recovery was calculated as in Eq 1.
Recovery (%) = {(Aa – Ai)/As} x 100 ………. (1)
where Aa, Ai and As are measured amount, initial amount and spiked amount, respectively.
Determination of amino acid contents
The contents of free amino acids in AN and CAN were determined using a fully-automated amino acid analyzer (Hitachi, L-8900A, Tokyo, Japan). A calibration curve was obtained with standard amino acid mixture (Sigma, St. Louis, MO, USA) and qualitative analysis was performed based on retention time and peak area of standard compounds.
Data analysis
All the tests were carried out in triplicate, and the data are presented as mean ± SD. Group comparison was performed by ANOVA (SPSS 16.0). P < 0.05 was considered statistically significant.
Results
Changes in pH and A420
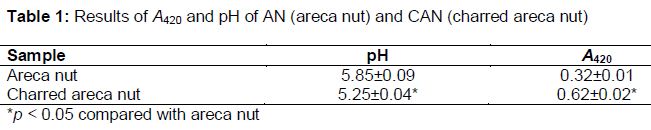
Results for pH and A420 are shown in . pH was significantly decreased (p < 0.05), whereas A420 value was significantly increased (p < 0.05) in CAN compared to AN.
Validation of the HPLC method
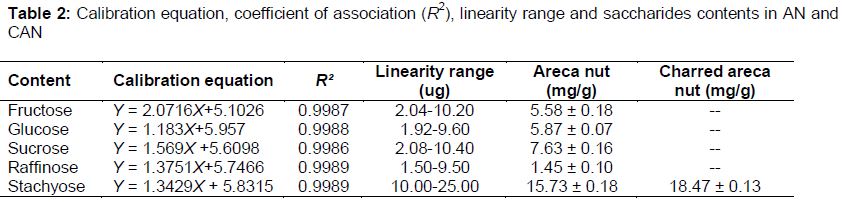
The HPLC method was validated for linearity, precision, repeatability, stability and recovery. The results of linearity test for the five sugars including calibration equation, coefficient of association (R2) and linearity range were shown in . The calibration equations for fructose, glucose, sucrose, raffinose, and stachyose were y = 1.9935x + 5.1398; y = 1.1781x + 5.9556; y = 1.569x + 5.6098; y = 1.3751x + 5.7466 and y = 1.3408x + 5.8366, respectively. In addition, the results showed that the calibration equations presented a good linear relationship (R² > 0.998), with linearity ranges of 2.04 - 10.20, 1.92-9.60, 2.08 - 10.40, 1.50 - 9.50 and 10.00 - 25.00 ug, respectively.
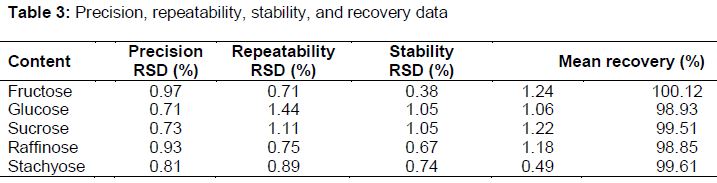
The results of precision tests are shown in . The peak area RSD values of the five saccharides were 0.97, 0.71, 0.73, 0.93 and 0.81, respectively. The results of precision tests indicated that HPLC system presented a good precision.
The results of repeatability tests, stability tests and recovery tests are shown in . RSD values of the five sugars were below 3. The results demonstrate that the HPLC method of sugar determination exhibited good repeatability and accuracy. The RSDs of the peak areas were also below 3, which indicate that the aqueous extracts were stable for 24 h.
Changes in saccharide contents
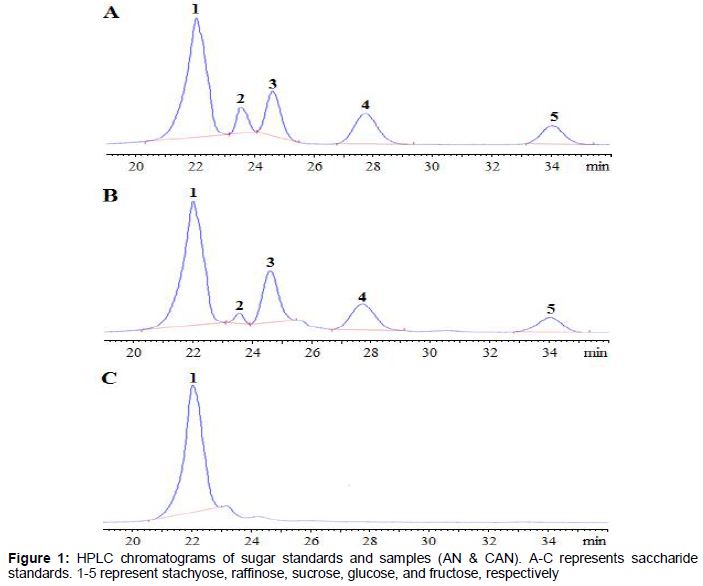
HPLC chromatograms of the standards and samples are shown in , while the levels of fructose, glucose, sucrose, raffinose, and stachyose in AN and CAN are depicted in . The results show that fructose, glucose, sucrose, raffinose, and stachyose are the main reducing sugars in AN. However, the main reducing sugar in CAN is stachyose. The present study demonstrates that the contents of fructose, glucose, sucrose and raffinose decreased, whereas the content of stachyose increased after AN was processed to CAN by stir-baking.
Changes in free amino acids
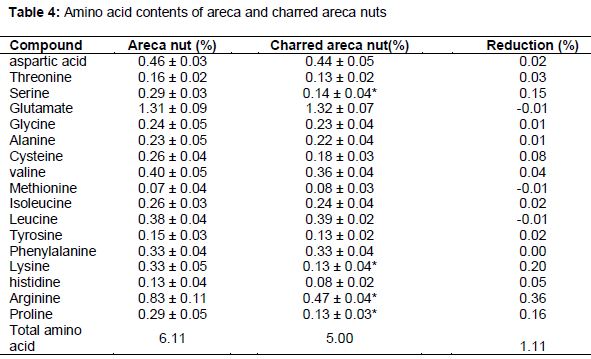
The results for levels of free amino acids in AN and CAN are shown in . It shows that 17 amino acids were detected in AN and CAN. The content of free amino acids decreased in CAN, when compared to AN. In addition, serine, lysine, arginine and proline were significantly decreased after AN was processed to CAN.
Discussion
The saccharide and free amino acid changes were determined in AN and its processed products (CAN) in the present research, and the results showed that MR during the processing of AN to CAN might be related to changes in levels of reducing sugars (fructose and glucose) and free amino acids (serine, lysine, arginine and proline).
MR occurs in three stages: initial, intermediate and final stages. The initial stage involves formation of sugar amine and Amadori re-arrangement, a process which generates colorless products. During the intermediate stage, the color of the reaction products is weak, or yellow, with strong absorption in the near-ultraviolet region. In the final stage, highly colored compounds are generated from aldol condensation and aldehyde-amide polymeri-zation [2].
It has been reported that pH decreases rapidly with heating time during MRs [10]. MR occurs between free amino groups of peptides or amino acids and carbonyl groups of reducing sugars, resulting in acidic pH due to consumption of amino groups [11], leading to rapid decrease in pH. Furthermore, the reactants, intermediates and end-products of MR, such as formic acid, acetic acid and glyoxal, being acidic, also result in decreases in pH [12]. In addition, A420 is considered an indicator of the final stage of MR, which can be used as index of browning intensity due to formation of brown pigments [12,13]. Indeed UV absorbance at 420 nm gives an indication of the intensity of the browning process during MR. In the present study, compared to the AN, pH value decreased whereas A420 value increased in CAN, indicating that MR occurred during the process stir-backing.
MR is a complex reaction initiated between carbonyl groups of reducing sugars and free amino groups [14]. The main reducing sugars that participate in MR are disaccharides (sucrose or lactose), pentoses (xylose, ribose and arabinose) and hexoses (glucose, fructose, mannose and galactose) [15].The concentration and types of sugar influence the type of MR products [15]. Specific combinations of amino acids and reducing sugars can produce a variety of specific flavors [14]. Many studies have reported that serine, lysine, arginine and proline react with fructose or glucose to generate volatile compounds with aroma, and their reaction mechanisms are already elucidated [16-19]. In the present study, the significant decreases in contents of reducing sugars (fructose and glucose) and free amino acids (serine, lysine, arginine and proline) in CAN, relative to AN demonstrate that in the stir-baking process, the mechanism of MR is related to decreases in amounts of reducing sugars (fructose and glucose) and free amino acids (serine, lysine, arginine and proline). The HPLC method used for detecting the sugar contents was validated for linearity, precision, repeatability, stability and recovery. The results revealed that the method exhibited good linearity, precision, repeatability, stability and accuracy, indicating that it was very suitable for determination of saccharide contents of AN and CAN.
Conclusion
The results of the present study indicate that MR occurs during the processing of AN to CAN, the underlying mechanism of which may be related to changes in reducing sugars and amino acids.
Declarations
Acknowledgement
References
Archives


News Updates